فایل: د شناخت نمبر(آی دی)
pdf د دي فایل د داونلود کولو لپاره سیستم ته ننوڅئ.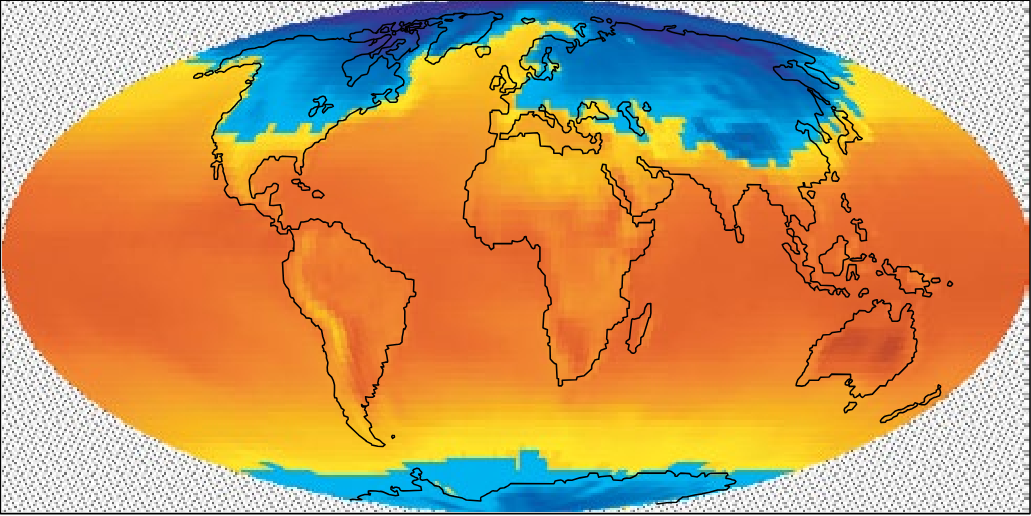 In this learning activity, students use
visualizations to make sense of elevation
and temperature data and to explore the
relationships between the two variables.
Students color in visualizations of elevation
and temperature so that important patterns
in the data become evident. The relationship
between the two quantities is studied by
using them to compute the lapse rate,
the rate at which temperature falls with
increasing elevation.
د دی مطلب په هکله
په لاندې ژبو کې موجود دی
د سرچیني کچه
Secondary High School (9-12) Grade 10 Grade 11 Grade 12 Grade 9 Middle (7-8) Grade 7 Grade 8د مطلب ډول
لیکونکی
نشرکوونکي
جواز/ د چاپ حق لرونکی
CC 0 / public domain